
“When the waterholes were dry, people sought to drink at the mirage.” –Evelyn Waugh
Well September was a lot of fun. Everyone came back from vacation, and suddenly they all wished they were back on vacation. The month was a volatile session featuring a Guy Fieri-like menu of heat, anger, capitulation, and finally some hope; it was a month that put spiking treasury yields in the spotlight, punctuated on a few off-days with some recessionary fear. Markets now flinch at any data that seems to encourage the Fed to keep hiking. At different parts of September, we were witness to underwhelming economic data or anecdotal evidence of a building lull in the economy, maybe even recessionary, and the equity market responded by rallying. In other words, the market seems to be hoping for data points that will slow or stop the Fed, and there seems to be little thought or cares as to what that might mean soon beyond that. Fear of the Fed is seemingly what defines this market.
At the same time, we must not only look past the initial focus on the Fed and contemplate some of the ripple effects the current environment is creating. In terms of fixed income, we pause to consider what the dual response of a slowing economy and a rising rate environment actually means, and furthermore perhaps, contemplate what that might mean for one specific segment of the fixed income universe: the high yield market. On the weaker end of the credit spectrum, firms in this area of creditworthiness tend to be one of two types: 1) those who are comfortable operating there and feel they are most efficient when they integrate the corporate and capital characteristics rating agencies feel meet a rating level most reflective of subinvestment grade; and 2) those who have been downgraded by those same rating agencies to that level. However you got there, each of these firms is facing similar issues that could impact them in a near-term fashion: rising rates and widening credit spreads. It can be a lethal combination and there is cause to worry that it might push the more vulnerable credits towards default. But perhaps this time, that concern is a bit overblown.
Source: Bloomberg
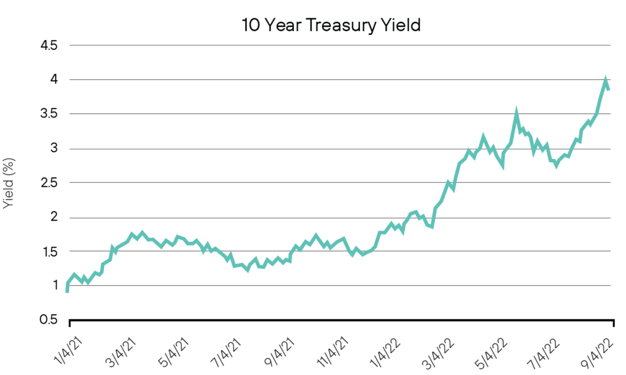
It’s been quite a ride as the Fed hawks have finally had their day, and while a great deal of attention has been spent on the 2-year treasury note, given that it seems to have been taking the brunt of the rate hikes in terms of volatility, certainly the 10-year treasury note is worth paying attention to as well. The importance of the 10 year is that typically when high yield new issue occurs the maturity tenors tend to be in the 7 to 10-year range; unlike their highgrade corporate cousins where we can see 20 year, 30 year and even 100 year maturities. Despite the inversion in the yield curve between the 10 year and 2-year treasury notes, the 10-year has certainly seen yield pressures, moving from around 91 bps at the start of 2021 to 3.8% as of the end of September 2022. A movement of almost 300 bps in a little over 20 months. That type of movement means, of course, much higher borrowing costs for high yield issuers and those corporations in that bucket tend to carry high leverage meaning the additional costs of financing can prove quite damaging if they have to rush to market at inopportune times.
The market has been noticing. As concerns mount over a recession and the impact of that type of economy (including the higher interest rates), we have been witness to credit spread widening which is somewhat to be expected. After years of low rates, investors got used to reaching for yield. Those who played in investment grade dabbled into the BBs for some slight yield pickup, comfortable in a mostly benign credit environment and an accommodative Fed. Similarly, we saw BB buyers slide comfortably into single B, and we saw CCCs post solid returns over the past few years. But with higher yields available, there is less reason to stray in terms of credit. Add in a potential recession and you get what is illustrated below. BBs, Bs and CCCs are all seeing a widening of credit spreads incrementally higher than the 10-year average in each respective category.
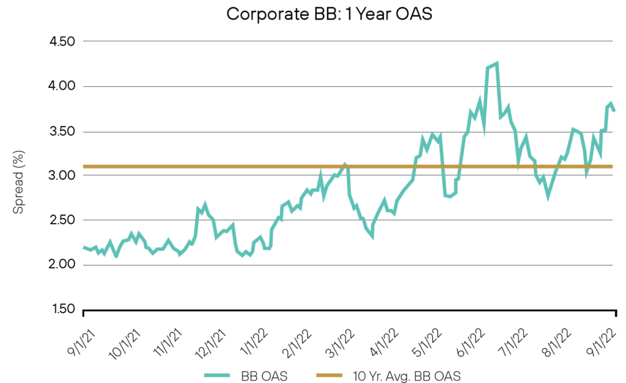
Source: Federal Reserve
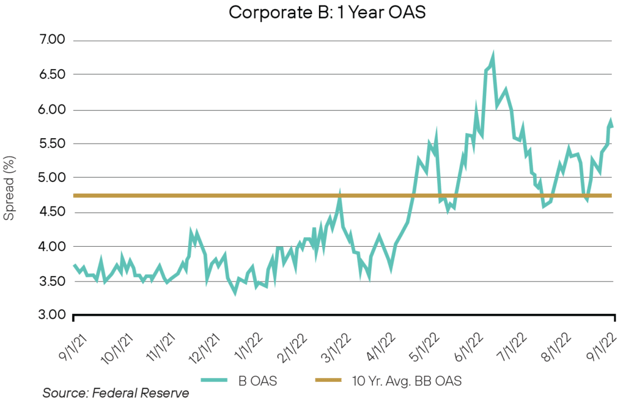
Source: Federal Reserve
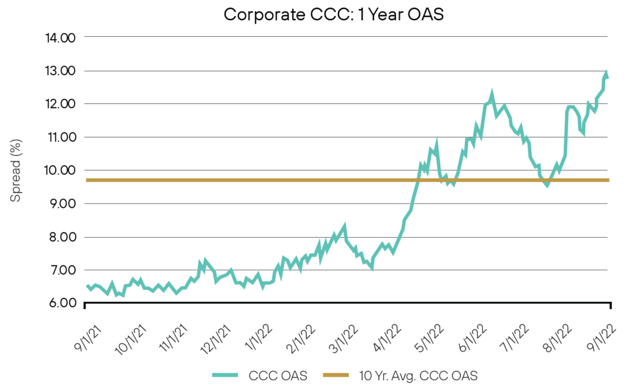
Source: Federal Reserve
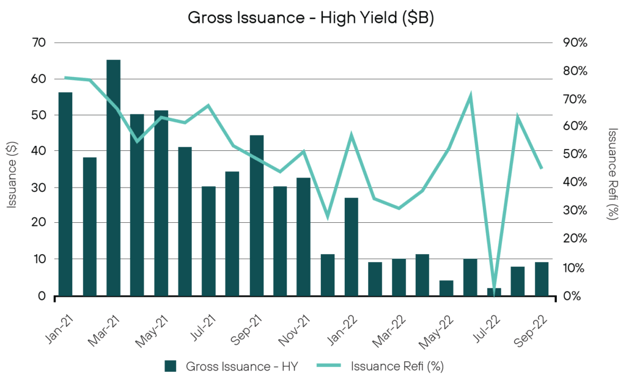
With the market volatility, firms have been reluctant to issue and investors have been less eager to jump into whatever new issuance emerges. Such that the question becomes “what happens if these high yield firms have to issue?” Right now, the picture is pretty benign. Corporate issuance, as we have written about over the past few years, had been historically high. As a result, it would seem most corporations took advantage of low rates to raise supportive levels of cash not only for current needs but also for a rainy day. That is, they went ahead and took advantage of the rate environment to issue debt, whether they
needed to or not, just to lock in low rates. As illustrated below, gross issuance for high yield has pretty much dried up over the last 9 months, as the markets remained shuttered due to the volatility. Better yet, if one looks to when issuance was heaviest (January 2021 through June 2021), less than 50% of that amount seems to be for refinancing purposes. In other words, what we would expect and hope for. Firms took advantage on a timely basis to lock in rates and as the rates took off, issuance has backed off as firms didn’t need to issue to keep themselves going.
Source: JP Morgan
Better yet, it does not appear that the high yield market overall has a dramatic need to issue debt in the near term in any great amounts for future refinancing purposes. The story might be different for an individual credit here or there, but overall, the high yield market does not seem to be under any near-term pressure to issue debt to replace near-term maturities. As one can see below, according to Goldman Sachs, maturities over the next year are relatively small and a “maturity wall” isn’t really a concern until sometime in 2026. This is good news, as it relieves pressure on these firms to force the markets into funding them at what would be extremely punitive levels, which in turn might harm their ability in a debt service manner to operate efficiently and profitably in the future, further burdening them if a recession were to hit and revenues and cash flows came under stress.
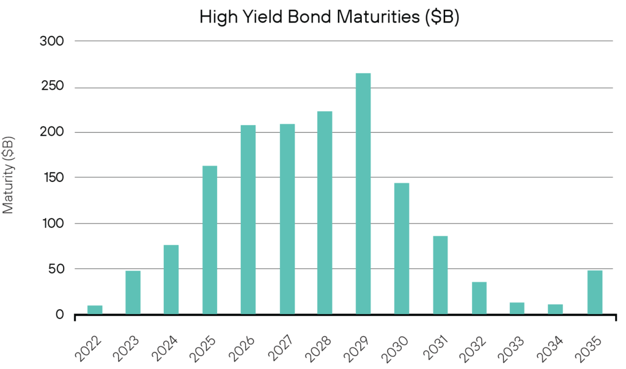
Source: Goldman Sachs
All of this means that rates aren’t necessarily the pressure point on the high yield market as one would expect, given their lack of need for financing in the near-term. But that doesn’t mean the high yield market is without risk. The widening credit spreads indicate the market is getting a bit leery about how these firms will perform in a slowing to recessionary period. There are obviously concerns that defaults will rise. The relatively bad news is that all expectations are that default rates will rise; however, one must also consider that over the past two years, those default rates have been extremely low. Thus, while default rates are expected to increase (and they certainly have some already this year), for the most part, they will be increasing off recent lows. As such, defaults, according to JP Morgan, are expected to be ultimately right at, or slightly below, the 10-year average. While that is noteworthy given from where we are coming from, it is merely a return to what we typically would expect to see in that sector.
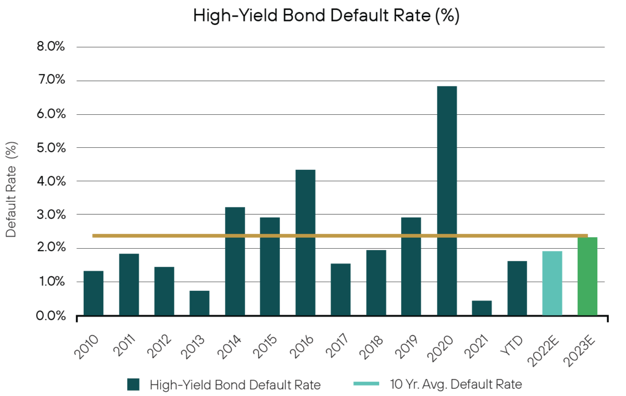
Source: JP Morgan
The high yield market is in better shape than one might expect and should be able to weather the current rate environment as well as future expected economic slowdown. That doesn’t mean we expect the sector to sail by unimpacted. Far from it. We do expect some pain, and we expect there will be certain credits that don’t make it out unscathed. Nevertheless, we do feel by staying true to our approved issuer list and consistent in picking a best-in-class type of target, those credits should continue to operate efficiently and up to expectations. Assuming spreads in high yield do widen further, and we do expect this to continue and perhaps accelerate once a slowdown occurs, we feel opportunities will become available to pick up solid credits at wide levels and thereby capture long-term over performance. Overall, we tend to prefer the higher end of the high yield spectrum, that is, BB credits, where we feel spread widening might not be as volatile and where we feel a more consistent and less volatile performance can be captured. By understanding the headwinds that are on the horizon for high yield and making sure we remain true to our approved targets, we feel over-performance and opportunities will be available in the future.
 |
 |
Definition of Terms
Basis Points (bps) – refers to a common unit of measure for interest rates and other percentages in finance. One basis point is equal to 1/100th of 1%, or 0.01%, or 0.0001, and is used to denote the percentage change in a financial instrument.
Curvature – A yield curve is a line that plots yields (interest rates) of bonds having equal credit quality but differing maturity dates. The slope of the yield curve gives an idea of future interest rate changes and economic activity.
Mortgage-Backed Security (MBS) – A mortgage-backed security is an investment similar to a bond that is made up of a bundle of home loans bought from the banks that issued them.
Collateralized Loan Obligation (CLO) – A collateralized loan obligation is a single security backed by a pool of debt.
Commercial Real Estate Loan (CRE) – A mortgage secured by a lien on commercial property as opposed to residential property.
CRE CLO – The underlying assets of a CRE CLO are short-term floating rate loans collateralized by transitional properties.
Asset-Backed Security (ABS) – An asset-backed security is an investment security—a bond or note—which is collateralized by a pool of assets, such as loans, leases, credit card debt, royalties, or receivables.
Option-Adjusted Spread (OAS) – The measurement of the spread of a fixed-income security rate and the risk-free rate of return, which is then adjusted to take into account an embedded option.
Enhanced Equipment Trust Certificate (EETC) – One form of equipment trust certificate that is issued and managed through special purpose vehicles known as pass-through trusts. These special purpose vehicles (SPEs) allow borrowers to aggregate multiple equipment purchases into one debt security
Real Estate Investment Trust (REIT) – A company that owns, operates, or finances income-generating real estate. Modeled after mutual funds, REITs pool the capital of numerous investors.
London InterBank Offered Rate (LIBOR) – a benchmark interest rate at which major global banks lend to one another in the international interbank market for short-term loans.
Secured Overnight Financing Rate (SOFR) – a benchmark interest rate for dollar-denominated derivatives and loans that is replacing the London interbank offered rate (LIBOR).
Delta – the ratio that compares the change in the price of an asset, usually marketable securities, to the corresponding change in the price of its derivative.
Commercial Mortgage-Backed Security (CMBS) – fixed-income investment products that are backed by mortgages on commercial properties rather than residential real estate.
Floating-Rate Note (FRN) – a bond with a variable interest rate that allows investors to benefit from rising interest rates.
Consumer Price Index (CPI) – a measure that examines the weighted average of prices of a basket of consumer goods and services, such as transportation, food, and medical care. It is calculated by taking price changes for each item in the predetermined basket of goods and averaging them.
Net Asset Value (NAV) – represents the net value of an entity and is calculated as the total value of the entity’s assets minus the total value of its liabilities.
S&P 500 – The Standard and Poor’s 500, or simply the S&P 500, is a stock market index tracking the stock performance of 500 large companies listed on exchanges in the United States.
German DAX – The DAX—also known as the Deutscher Aktien Index or the GER40—is a stock index that represents 40 of the largest and most liquid German companies that trade on the Frankfurt Exchange. The prices used to calculate the DAX Index come through Xetra, an electronic trading system.
NASDAQ – The Nasdaq Stock Market (National Association of Securities Dealers Automated Quotations Stock Market) is an American stock exchange based in New York City. It is ranked second on the list of stock exchanges by market capitalization of shares traded, behind the New York Stock Exchange.
MSCI EM Index – The MSCI Emerging Markets Index captures large and mid cap representation across 24 Emerging Markets (EM) countries. With 1,382 constituents, the index covers approximately 85% of the free float-adjusted market capitalization in each country.
Nikkei – The Nikkei is short for Japan’s Nikkei 225 Stock Average, the leading and most-respected index of Japanese stocks. It is a price-weighted index composed of Japan’s top 225 blue-chip companies traded on the Tokyo Stock Exchange.
Shanghai Composite – is a stock market index of all stocks (A shares and B shares) that are traded at the Shanghai Stock Exchange.
MOVE Index – The ICE BofA MOVE Index (MOVE) measures Treasury rate volatility through options pricing.
VIX Index – The Cboe Volatility Index (VIX) is a real-time index that represents the market’s expectations for the relative strength of near-term price changes of the S&P 500 Index (SPX).
Dow Jones Industrial Average – The Dow Jones Industrial Average is a price-weighted average of 30 blue-chip stocks that are generally the leaders in their industry.
Hang Seng – The Hang Seng Index is a free-float capitalization-weighted index of a selection of companies from the Stock Exchange of Hong Kong.
STOXX Europe 600 – The STOXX Europe 600, also called STOXX 600, SXXP, is a stock index of European stocks designed by STOXX Ltd. This index has a fixed number of 600 components representing large, mid and small capitalization companies among 17 European countries, covering approximately 90% of the free-float market capitalization of the European stock market (not limited to the Eurozone).
Euro STOXX 50 – The EURO STOXX 50 Index is a market capitalization weighted stock index of 50 large, blue-chip European companies operating within eurozone nations.
CAC (France) – is a benchmark French stock market index. The index represents a capitalization-weighted measure of the 40 most significant stocks among the 100 largest market caps on the Euronext Paris (formerly the Paris Bourse).
Duration Risk – the name economists give to the risk associated with the sensitivity of a bond’s price to a one percent change in interest rates.
Federal Open Market Committee (FOMC) – the branch of the Federal Reserve System (FRS) that determines the direction of monetary policy specifically by directing open market operations (OMO).
United States Treasury (UST) – the national treasury of the federal government of the United States where it serves as an executive department. The Treasury manages all of the money coming into the government and paid out by it.
High Yield (HY) – high-yield bonds (also called junk bonds) are bonds that pay higher interest rates because they have lower credit ratings than investment-grade bonds. High-yield bonds are more likely to default, so they must pay a higher yield than investment-grade bonds to compensate investors.
Investment Grade (IG) – an investment grade is a rating that signifies that a municipal or corporate bond presents a relatively low risk of default.
Exchange Traded Fund (ETF) – an exchange traded fund (ETF) is a type of security that tracks an index, sector, commodity, or other asset, but which can be purchased or sold on a stock exchange the same as a regular stock.
Federal Family Education Loan Program (FFELP) – a program that worked with private lenders to provide education loans guaranteed by the federal government.
Business Development Program (BDC) – an organization that invests in small- and medium-sized companies as well as distressed companies.
Control #: 15853642-UFD-10/25/2022