
I can resist anything except temptation.”
- Ocar Wilde
There are lots of things I like to eat. In that group of things are many things I’m not supposed to eat. It doesn’t matter how many times I am told not to or the reason. It doesn’t matter if you have warned me that one day I’m going to rue the day I put so many polysaturated fats in my body. It doesn’t matter that there is an urban legend that my stomach might explode by eating something like pop rocks when I was a kid. And as I get older it doesn’t seem to matter that it is something an adult probably shouldn’t eat. Any adult with kids at some point has definitely reestablished their love for animal crackers. And sure, like everyone I am cognizant of my weight, but if you catch me on the right day, I am sure I could eat a full package of Oreo cookies without blinking. The fact is, even if you know all the reasons for not eating those things the temptation is just too great.
As the rate hike cycle begins to wind down and the potential of a pause in rates becomes more and more a possibility, we need to consider what the current market is offering. That is, there is a considerable amount of momentum building for two near term steps. There is the possibility that rates stay high for a while, and yet there is also an assumption that we could very well see a rate cut by the end of the year. This dichotomy presents investors with an interesting and maybe tempting near term possibility. With us exiting an unprecedented rate hike cycle, we now see yields at levels not seen in decades. The higher yields are obviously quite tempting. At the same time, we could be looking at softening economic activity which would lead toward worsening credit conditions and ultimately widening credit spreads. In other words, the yields are tempting but is there potential credit risk on the horizon that will make that reach ultimately painful?
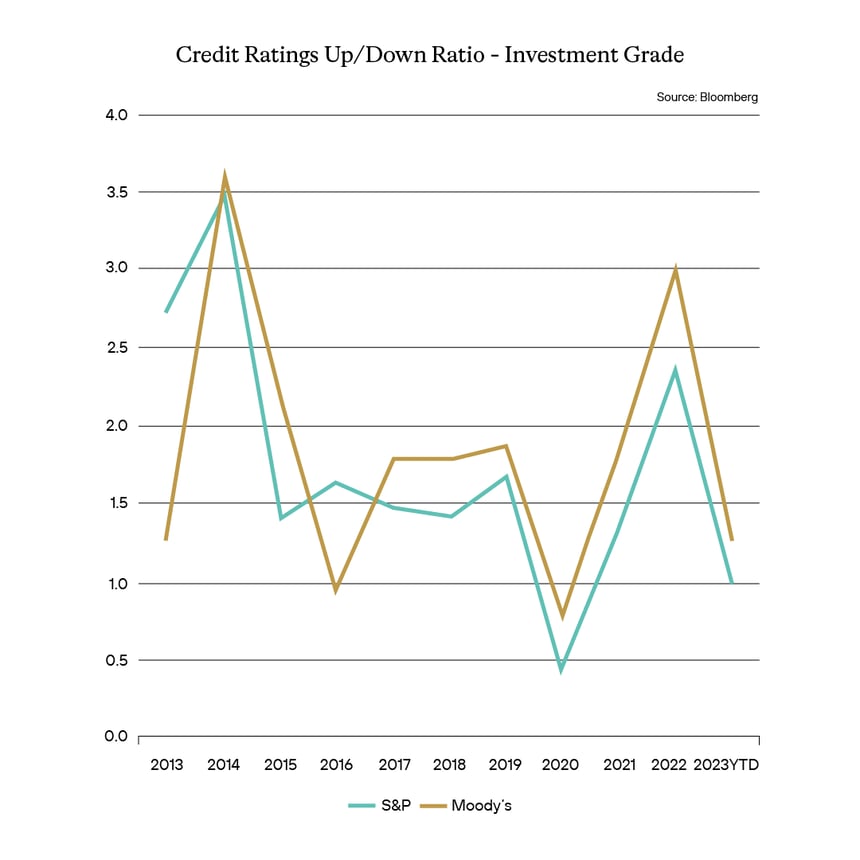
One signal we have been looking at is the rating agencies up/down ratio. That is, upgrades to downgrades and where we are in the cycle. Rating agencies are not known for being ahead of the curve, but more reactionary to conditions. As such, their actions tend to lag credit conditions. For investment grade issuers, as illustrated above, we are beginning to see a trend developing. We can see that the ratio spiked up in 2022, which would seem odd given that we were seeing higher rates. But given the lag in rating actions to conditions - not unusual. For 2023, we are already seeing year-to-date that the ratio has begun to reverse. In this case, unlike 2022 where upgrades were much higher than the number of downgrades, at a ratio of around 1.0, that would indicate that the pace of upgrades to downgrades is roughly even. Nevertheless, it is a trend that would signal that we should expect to see more downgrades in the near term.
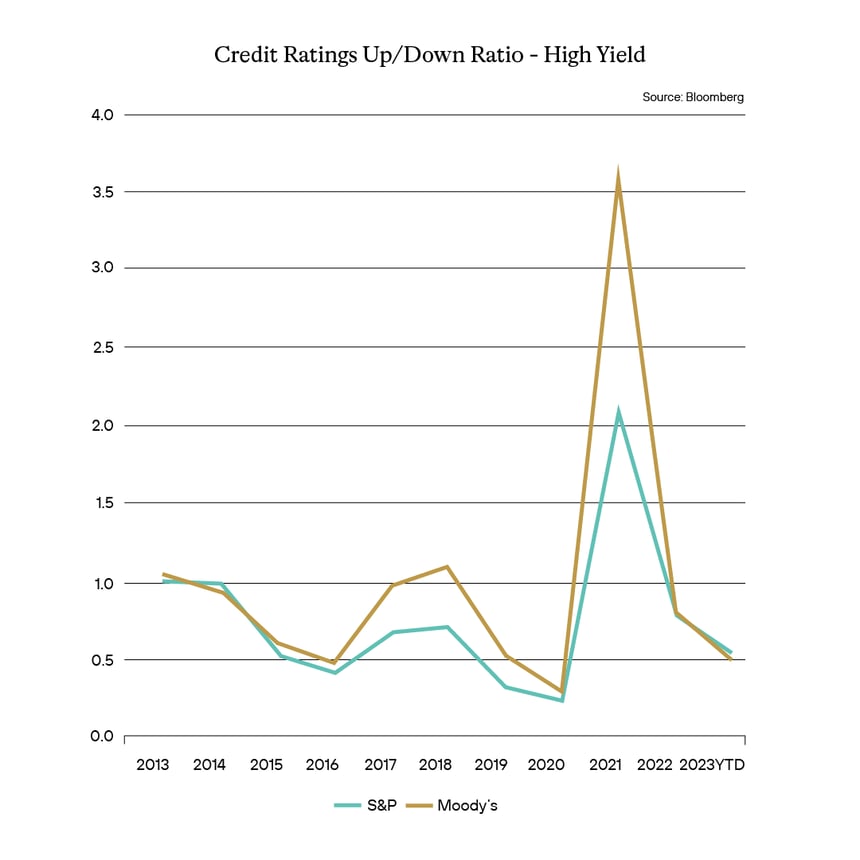
A similar but expedited version of that type of reaction can be seen in high yield. In this instance, the up/down ratio seemed to have peaked in 2021 and with the full brunt of the rate hikes taking effect, we are seeing what that means to high yield issuers. The higher cost of financing seems to be taking its toll and weaker credits are seeing faster rates of downgrades as they operate in this more onerous rate environment. In fact in 2022, unlike investment grade where the upgrades to downgrades were about even, there were more downgrades than upgrades. For 2023, we see a continuation of this trend. So if rates stay high for at least the near term or for longer than expected that could have an obvious impact on the credit ratings of issuers in this area of the credit stack. And as a result, we would expect to see the widening of credit spreads continue.
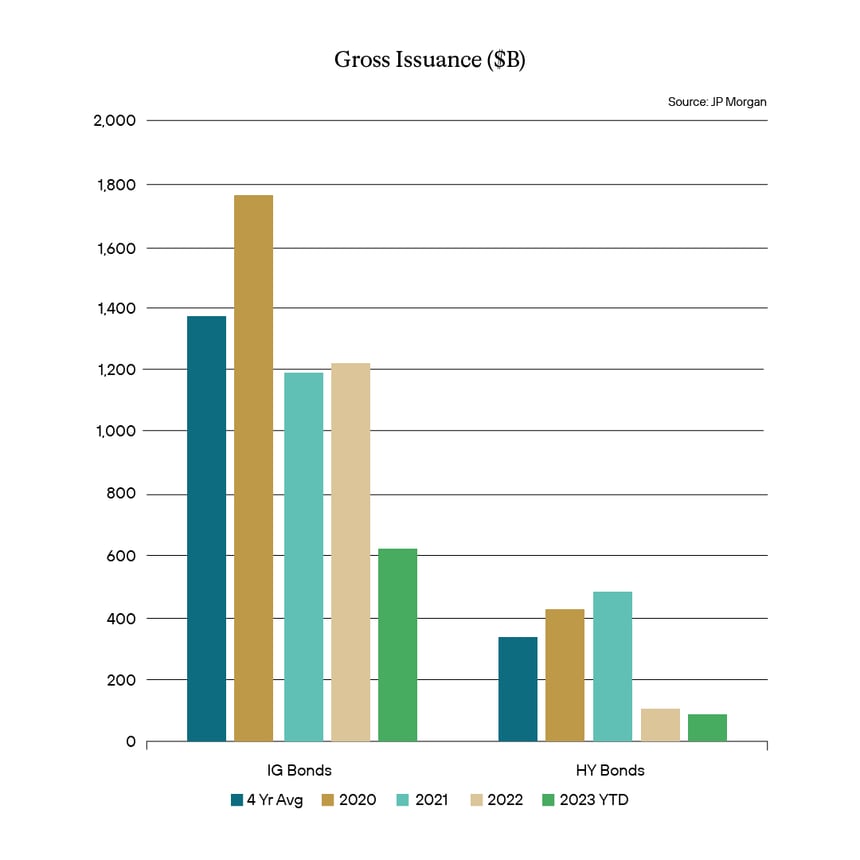
Overall new Issuance can also provide a signal. How eager are investors to take down the newer offerings. Are those higher yields that tempting? For investment grade issuers, the start of 2023 has been met with sufficient demand. With higher yields available, and potentially with redemptions slowing, money managers have created enough demand that 2023 issuance seems to be on a pace to exceed that of 2021 and 2022, which both trailed the 4 year average in terms of gross issuance. That would seem to indicate that while demand is not overly aggressive, there is appetite there.
For high yield - potentially a slightly different viewpoint. As can be seen, 2020 and 2021 were big issuance years for high yield issuers. As rates were being hiked, no doubt issuers ran into the market hoping to get financing before rates topped off. For 2022, with rates near their highs and investors watching both hikes and credit spread widening negatively impact their bond prices, there was definitely less demand for this paper. But interestingly enough, with rate hikes expected to pause, peak rates on new issue are tempting enough to get some traction such that issuance, while still far below the go-go years of 2021 and 2020, should surpass that of 2022.
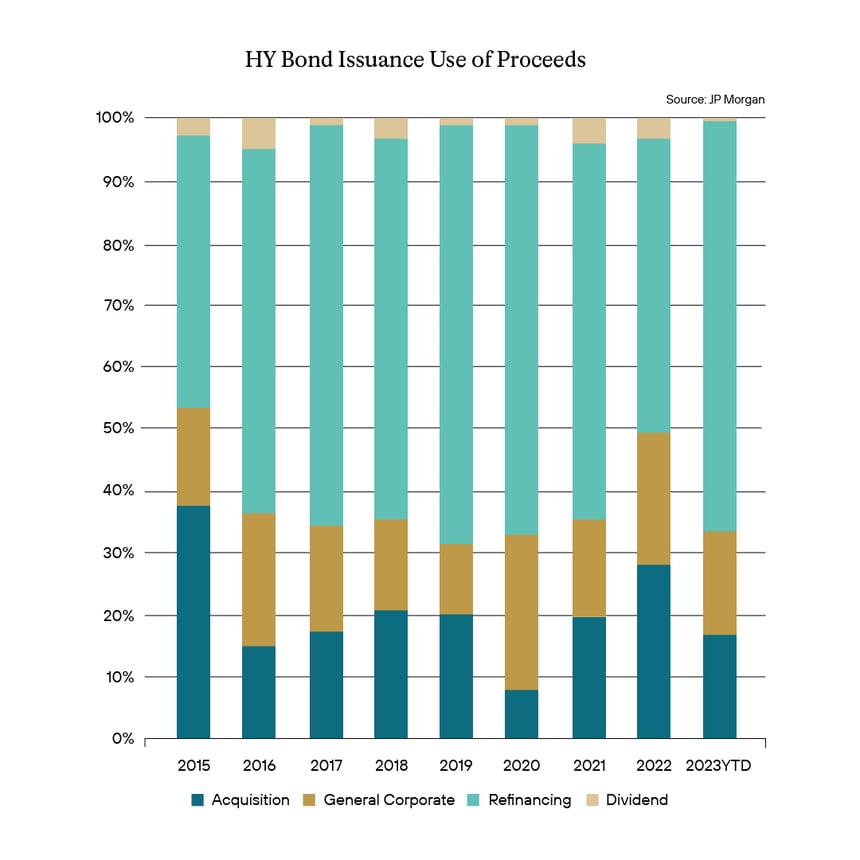
So the rating agency trends are giving us pause, but the last thing we’d take a glance are the trends behind the reasons for issuance. Most companies wouldn’t be eager to issue into this higher rate environment, simply to avoid the higher cost of financing. Why do so if you don’t have to? So a glance at the trend in terms of use of proceeds might also give us a clue as to the overall health of the credits we are looking at. We do expect a softening credit environment, and the use of proceeds might help us shape thoughts on whether the companies themselves have similar thoughts.
In this environment we’d like to see signs of strength. While refinancing can be a signal of strength, that is, issuers know their name creates demand, issuing in an environment where higher rates are prevalent would or could indicate a lack of foresight in terms of management planning. For investment grade issuers we are seeing solid signals. Refinancing activity is about average, and we are seeing more issuance, almost double in fact for 2023 on a percentage basis than in 2022 and 2021 for Mergers & Acquisitions (M&A). That is certainly a sign of strength. Interestingly enough, general corporate purposes issuance has dropped. An assumption behind this would be that in the previous two years, 2021 and 2022, investment grade issuers took advantage of low rates to issue into that demand as a means to lock in future flexibility with low cost debt, anticipating that future rates might be more onerous. This would again be an indication of management planning and foresight and a solid response to that rate environment.
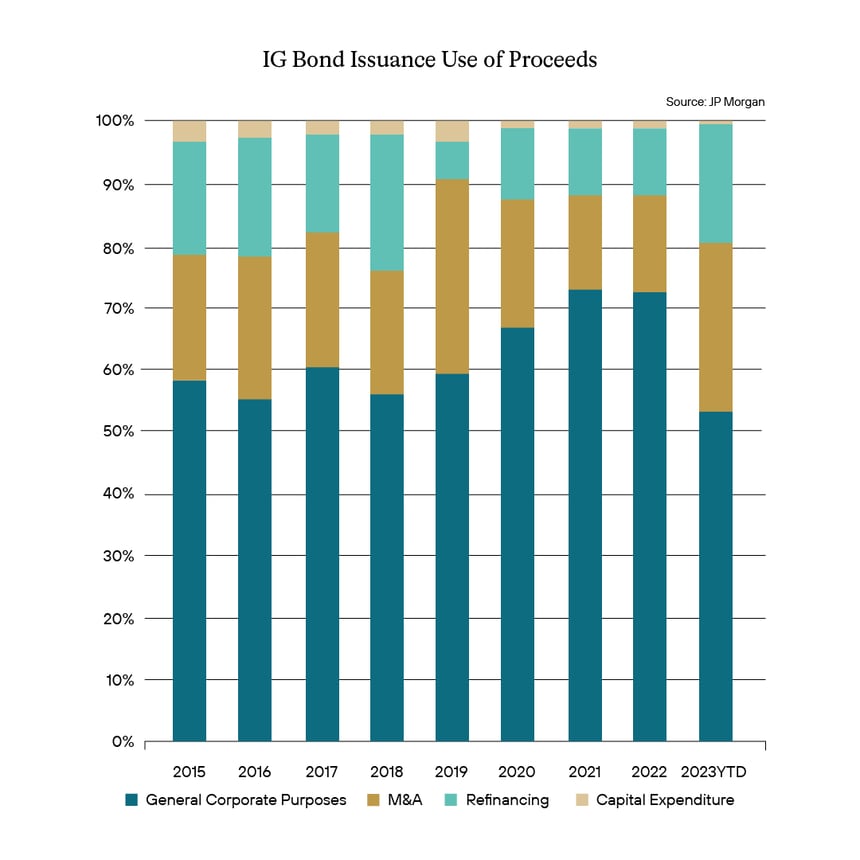
For high yield we are seeing a different response. The relative good news is that we aren’t seeing much interest in borrowing to pay a dividend. Certainly as a creditor, watching a company extending itself and borrowing at such a high relative cost simply to pay a dividend or initiating other more shareholder friendly activities would be concerning. Nevertheless, the majority of issuance activity seems to be for refinancing. And that is not a sign that issuing into this higher borrowing cost environment is of necessity. That would lead us to believe that issuers borrowing at these higher costs do so to simply keep going, not for expansion or growth reasons, and it would indicate not only some poor planning but worse, potentially a little desperation.
We are now at an interesting and important point in the market. The Fed’s aggressive rate hiking cycle might be ending, but it has left us at a point where rates are at levels not seen in years. With that comes a few potential responses from issuers, investors and the overall markets. The use of various signals and trends help shape our view of what we expect and how best we might invest in that environment and capture over-performance. As such, based on several things, including some of that discussed above, we continue to stick to our investment thesis of the past several months. We continue to favor higher credit quality and prefer liquid issuers and sectors for the near term. The environment seems ripe for a higher number of downgrades than over the past few years and we would expect a widening in terms of liquidity premium to be paid and a widening of credit spreads. As tempting as what this might mean to the yields on lower rated and less liquid credits, we prefer to abstain from reaching for that and focus on the higher credit quality and liquid names as we expect in this type of cycle they should produce possible over-performance on a comparative basis.
 |
 |
Definition of Terms
Basis Points (bps) - refers to a common unit of measure for interest rates and other percentages in finance. One basis point is equal to 1/100th of 1%, or 0.01%, or 0.0001, and is used to denote the percentage change in a financial instrument.
Curvature - A yield curve is a line that plots yields (interest rates) of bonds having equal credit quality but differing maturity dates. The slope of the yield curve gives an idea of future interest rate changes and economic activity.
Mortgage-Backed Security (MBS) - A mortgage-backed security is an investment similar to a bond that is made up of a bundle of home loans bought from the banks that issued them.
Collateralized Loan Obligation (CLO) - A collateralized loan obligation is a single security backed by a pool of debt.
Commercial Real Estate Loan (CRE) - A mortgage secured by a lien on commercial property as opposed to residential property.
CRE CLO - The underlying assets of a CRE CLO are short-term floating rate loans collateralized by transitional properties.
Asset-Backed Security (ABS) - An asset-backed security is an investment security—a bond or note—which is collateralized by a pool of assets, such as loans, leases, credit card debt, royalties, or receivables
Option-Adjusted Spread (OAS) - The measurement of the spread of a fixed-income security rate and the risk-free rate of return, which is then adjusted to take into account an embedded option.
Enhanced Equipment Trust Certificate (EETC) - One form of equipment trust certificate that is issued and managed through special purpose vehicles known as pass-through trusts. These special purpose vehicles (SPEs) allow borrowers to aggregate multiple equipment purchases into one debt security
Real Estate Investment Trust (REIT) - A company that owns, operates, or finances income-generating real estate. Modeled after mutual funds, REITs pool the capital of numerous investors.
London InterBank Offered Rate (LIBOR) - a benchmark interest rate at which major global banks lend to one another in the international interbank market for short-term loans.
Secured Overnight Financing Rate (SOFR) - a benchmark interest rate for dollar-denominated derivatives and loans that is replacing the London interbank offered rate (LIBOR).
Delta - the ratio that compares the change in the price of an asset, usually marketable securities, to the corresponding change in the price of its derivative.
Commercial Mortgage - Backed Security (CMBS) - fixed-income investment products that are backed by mortgages on commercial properties rather than residential real estate.
Floating-Rate Note (FRN) - a bond with a variable interest rate that allows investors to benefit from rising interest rates.
Consumer Price Index (CPI) - a measure that examines the weighted average of prices of a basket of consumer goods and services, such as transportation, food, and medical care. It is calculated by taking price changes for each item in the predetermined basket of goods and averaging them.
Gross Domestic Product (GDP) - one of the most widely used measures of an economy's output or production. It is defined as the total value of goods and services produced within a country's borders in a specific time period—monthly, quarterly, or annually.
Perp - A perpetual bond, also known as a "consol bond" or "perp," is a fixed income security with no maturity date.
Nonfarm payrolls (NFPs) - the measure of the number of workers in the United States excluding farm workers and workers in a handful of other job classifications. This is measured by the federal Bureau of Labor Statistics (BLS), which surveys private and government entities throughout the U.S. about their payrolls.
Net Asset Value (NAV) - represents the net value of an entity and is calculated as the total value of the entity’s assets minus the total value of its liabilities.
S&P 500 - The Standard and Poor's 500, or simply the S&P 500, is a stock market index tracking the stock performance of 500 large companies listed on exchanges in the United States.
German DAX - The DAX—also known as the Deutscher Aktien Index or the GER40—is a stock index that represents 40 of the largest and most liquid German companies that trade on the Frankfurt Exchange. The prices used to calculate the DAX Index come through Xetra, an electronic trading system.
NASDAQ - The Nasdaq Stock Market (National Association of Securities Dealers Automated Quotations Stock Market) is an American stock exchange based in New York City. It is ranked second on the list of stock exchanges by market capitalization of shares traded, behind the New York Stock Exchange.
MSCI EM Index - The MSCI Emerging Markets Index captures large and mid cap representation across 24 Emerging Markets (EM) countries. With 1,382 constituents, the index covers approximately 85% of the free float-adjusted market capitalization in each country.
Nikkei - The Nikkei is short for Japan's Nikkei 225 Stock Average, the leading and most-respected index of Japanese stocks. It is a price-weighted index composed of Japan's top 225 blue-chip companies traded on the Tokyo Stock Exchange.
Shanghai Composite - is a stock market index of all stocks (A shares and B shares) that are traded at the Shanghai Stock Exchange.
Bloomberg U.S. Agg - The Bloomberg Aggregate Bond Index or "the Agg" is a broad-based fixed-income index used by bond traders and the managers of mutual funds and exchange-traded funds (ETFs) as a benchmark to measure their relative performance.
MOVE Index - The ICE BofA MOVE Index (MOVE) measures Treasury rate volatility through options pricing.
VIX Index - The Cboe Volatility Index (VIX) is a real-time index that represents the market’s expectations for the relative strength of near-term price changes of the S&P 500 Index (SPX).
Dow Jones Industrial Average - The Dow Jones Industrial Average is a price-weighted average of 30 blue-chip stocks that are generally the leaders in their industry.
Hang Seng - The Hang Seng Index is a free-float capitalization-weighted index of a selection of companies from the Stock Exchange of Hong Kong.
STOXX Europe 600 - The STOXX Europe 600, also called STOXX 600, SXXP, is a stock index of European stocks designed by STOXX Ltd. This index has a fixed number of 600 components representing large, mid and small capitalization companies among 17 European countries, covering approximately 90% of the free-float market capitalization of the European stock market (not limited to the Eurozone).
Euro STOXX 50 - The EURO STOXX 50 Index is a market capitalization weighted stock index of 50 large, blue-chip European companies operating within eurozone nations.
CAC (France) - is a benchmark French stock market index. The index represents a capitalization-weighted measure of the 40 most significant stocks among the 100 largest market caps on the Euronext Paris (formerly the Paris Bourse).
Duration Risk - the name economists give to the risk associated with the sensitivity of a bond's price to a one percent change in interest rates.
Federal Open Market Committee (FOMC) - the branch of the Federal Reserve System (FRS) that determines the direction of monetary policy specifically by directing open market operations (OMO).
United States Treasury (UST) - the national treasury of the federal government of the United States where it serves as an executive department. The Treasury manages all of the money coming into the government and paid out by it.
High Yield (HY) - high-yield bonds (also called junk bonds) are bonds that pay higher interest rates because they have lower credit ratings than investment-grade bonds. High-yield bonds are more likely to default, so they must pay a higher yield than investment-grade bonds to compensate investors.
Investment Grade (IG) - an investment grade is a rating that signifies that a municipal or corporate bond presents a relatively low risk of default.
Exchange Traded Fund (ETF) - an exchange traded fund (ETF) is a type of security that tracks an index, sector, commodity, or other asset, but which can be purchased or sold on a stock exchange the same as a regular stock.
Federal Family Education Loan Program (FFELP) - a program that worked with private lenders to provide education loans guaranteed by the federal government.
Business Development Program (BDC) - an organization that invests in small- and medium-sized companies as well as distressed companies.
Job Opening and Labor Turnover Survey (JOLTS) Report - is a monthly report by the Bureau of Labor Statistics (BLS) of the U.S. Department of Labor counting job vacancies and separations, including the number of workers voluntarily quitting employment.
Sifma - The Securities Industry and Financial Markets Association (SIFMA) is a not-for-profit trade association that represents securities brokerage firms, investment banking institutions, and other investment firms.
Duration - A calculation of the average life of a bond (or portfolio of bonds) that is a useful measure of the bond's price sensitivity to interest rate changes. The higher the duration number, the greater the risk and reward potential of the bond.
Control #: 17014917-UFD-6/14/2023